Welcome to the eSignal New User Orientation. This guide is designed to help you learn the basics of eSignal as well as provide you with additional resources and support tools.
Learn about Market Screener Plus as well as a host of new features available with eSignal 12 Series.
If you're looking for eSignal Live Webinars, you can find them here.
Jump to Section
Download
Before you download the software or start your service, please review the eSignal System Requirements to ensure that your PC will work with eSignal.
eSignal has two versions available to support a broader range of PCs, 32-bit and 64-bit. To find out which version is best for you, right-click the Computer icon on your Desktop or Start Menu and select Properties. The System type will determine which version you’ll need to download.

Once you’ve determined your System type, go to the Download page and choose the appropriate download. When the download is complete click Run. Accept the License Agreement and continue selecting Next until you are prompted to enter your Username and Password (both of which are case sensitive). Click Install followed by Finish.
For detailed installation instructions, see our KnowledgeBase article titled “eSignal Installation Instructions” or check out the pre-recorded video.
Once the installation is complete, you’ll see the eSignal icon on your Desktop.

CONFIGURATION
After downloading and installing the program, you may want to configure many of the programs features such the appearance, language, time settings, formatting, trading settings, etc. by left-clicking the eSignal icon on the main menu bar.

Appearance: Edit the color theme, language, and more using the Appearance menu. Please note that you must restart the application to implement changes to the color theme and language settings. Window mode controls how the windows in your page are docked. Font size options include Tiny, Small, Normal, Large, and Extra Large. Periodically we’ll broadcast a message via a popup window in the application (such as upgrade notices, etc). To disable these pop-ups, uncheck the setting for Show pop-up window on notification event.

Theme: Themes allow you to customize the overall look and color of the application. There are two color themes currently available: the default Graphite (Black) and Frost (White).

Language: eSignal offers the ability to use the application in a different language. Each word or phrase within the application has an identifier associated with it. With the Language packs, we’ve mapped each text piece with a translated version of that same word. Version 11 has been translated into 9 different languages so far: English, Spanish, German, French, Italian, Russian, Chinese, Japanese, and Portuguese.
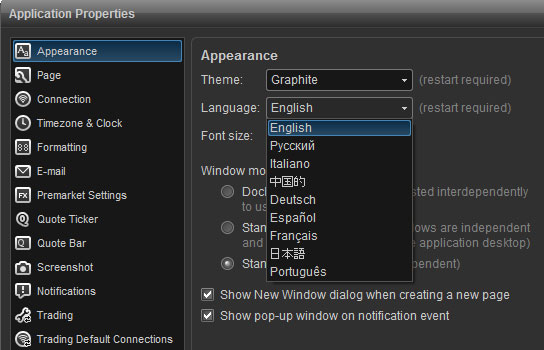
Please note that you must restart the application to implement the new language setting. In the event that you inadvertently select the wrong language you can navigate to the same menu and English will be the first language listed. In this example we have selected Japanese:

Docked Windows: By default, the page mode in the program is set to Docked, which means that any new window opened will snap (or autosize) to the other windows in the page without any overlapping. Moving windows around is as easy as dragging a window to a new location. In this mode all the other windows adjust to the new location automatically. Windows can be detached (floated, popped out) simply by clicking a dragging to a new monitor. Press the Control key while dragging the window to return a detached window.
You can change the window mode to Standard if you wish to manually resize a window without having the adjoining windows resize automatically or Standard with AutoSize if you want them to.
Formatting
Show Full Price Precision is tailored towards stocks trading in sub penny increments. Once enabled, full precision is displayed (i.e. more than 2 decimal places). With this setting unchecked, the decimal place will display in the hundredths (2 decimals).
Compact Price Display is tailored towards futures. If this setting is checked, the decimal place will not be displayed for Futures. Unchecked, you’ll see a decimal place for Futures.
The Volume setting controls how the volume is displayed in the Watch List and other windows. Whole Number will display the entire volume figure (16500000). Abbreviated will round to the first 3 figures (16.5M). Comma Separatedwill display the volume figure with commas (16,500,000).
The Dollar Value setting controls how Dollars will be displayed in a portfolio. Whole Number will display the entire Dollar figure (10000.00). Abbreviated will round to the first 3 figures (10K). Comma Separated will display the dollar figure with commas (10,000.00). You can also add more Digits after the Decimal place for dollar values.

CUSTOMIZING TOOLBARS AND KEYBOARD COMMANDS
Customize Toolbars: Customize Toolbars feature allows you to select which icons are displayed on your toolbars. The toolbars are turned on by default and are located across the top of the workspace. By right-clicking on an existing toolbar, you can choose any command in eSignal and create a button for it.

You can click and drag the toolbars to move them anywhere in your workspace. They can also be docked to the right, left, top, or bottom of your page.

Click here for more information on customizing toolbars.
Customize Keyboard: The Customize Keyboard feature allows you to create keyboard shortcuts for many of the commands and menu items used in eSignal. This tool allows one to quickly access frequently used functions and windows.
Opening the Customize Keyboard Window: The Customize Keyboard feature is located under the Options menu at the top of eSignal.

Window Overview:

Create New Shortcut Key: To create a keyboard shortcut, select a command from the Commands list. Open Edit Chart Dialog has been highlighted in the example below. Click the field for Add Shortcut Key, select the key(s) you want to associate the keyboard shortcut with. You’ll notice that a combination of keystrokes can be used (popular variations include the Alt, Ctrl, and Shift keys). Once you’ve entered the shortcut key, click the Add Shortcut button (+ sign) and you’re ready to go. Using the example shown, we’ve assigned the F11 key to open the Edit Chart menu.

Click here for more information on customizing the keyboard.
PAGES
A Page is comprised of several window types (i.e., Watch List, Chart, Market Depth, etc). When you first launch eSignal, you’ll see a sample page titled “Main”.

The window type, size, and orientation are all saved as part of the Page file. Any time you make changes to your workspace it’s recommended that you save your Page so that your work is properly saved. In addition, a backup of your Page files is advised anytime you re-install or upgrade to a newer version.

Creating a New Page
To create a new page, click the eSignal button, ![]() , on the main menu followed by New Page (or click the plus [+] sign in the bottom left corner of the screen). You’ll see a New Window menu that will allow you to open various windows types. Select a window type then click Create. You can open several of the same window types in this menu such (i.e. three charts and two Watch Lists). To open a new window once this menu is closed, click New from the main menu then select a window type.
, on the main menu followed by New Page (or click the plus [+] sign in the bottom left corner of the screen). You’ll see a New Window menu that will allow you to open various windows types. Select a window type then click Create. You can open several of the same window types in this menu such (i.e. three charts and two Watch Lists). To open a new window once this menu is closed, click New from the main menu then select a window type.

Saving Pages
Once all the windows in your page have been organized and configured, click the eSignal button,![]() , from the main menu and choose Save Page As. Assign the page a new name then click Save. In the example below we’ve created a custom page called MAIN PAGE. You’ll notice that pages appear as tabs at the bottom of the screen making it easy to quickly switch from page to page.
, from the main menu and choose Save Page As. Assign the page a new name then click Save. In the example below we’ve created a custom page called MAIN PAGE. You’ll notice that pages appear as tabs at the bottom of the screen making it easy to quickly switch from page to page.
Click here for more information for using pages.
WORKSPACES
Workspaces allow you to create groups of pages and switch between them with a single click. For example, you may want group of pages relating to stocks and another to futures.
New Workspace: To create a new Workspace, click the eSignal button,![]() , in the top left hand corner and selectNew Workspace.
, in the top left hand corner and selectNew Workspace.

After selecting New Workspace you will be prompted to give the Workspace a name. Enter the name for the Workspace and click OK.
After clicking OK you will be taken to the New Window dialog box so that you can start building the first Page in your New Workspace. For information on building Pages, please Click here.

Click here for more information on using workspaces.
WATCH LIST
The Watch List allows you to track your symbols in a spreadsheet format. To open a Watch List window go to the main menu and select New, then click Watch List.

Once a new Watch List opens, enter a new symbol by clicking on any empty row under the Symbol column. Type the symbol and click Enter.
Watch List Title Bar

The Symbol List stores sample and user created symbol lists. To create a new list, select the Edit List icon followed by New List. Once you have entered all your symbols, select Save List (also under the Edit List menu) to ensure that all your work is saved. The Edit List menu also contains the option to Rename, Duplicate, and Remove existing Lists.
The Headings box allows you to select from a list of pre-set headings designed for Stocks, Futures, Options and other contract types. There is also the ability to create and save new custom headings along with renaming, duplicating, or removing existing ones.
The Summary Mode button allows you to toggle the display of the Watch List between the Standard mode and the Summary mode. The Standard Mode displays the symbols vertically under a single Symbol column. The Summary Mode displays multiple column headings in the same row which allows more symbols to be displayed in the same space.
The Sorting Panel allows you to sort by multiple column headings. Select your primary sort criteria (Sort by) followed by two additional criteria (then by and finally by).
Adding Columns: To add a new column to the Watch List, right-click an existing column and select Add Columns.

Once the column has been added, you can click-and-drag to set the order of the columns.
Adding Columns for EFS Studies: The ability to add column to display the value of a built-in or custom EFS study has been added in eSignal.
You can add a study or formula to your Watch List in the same way that you would add a new column. Right-click on an existing column header and select Add Columns. You’ll notice tabs for Built-in Studies, and Add-on Studies (subscription based), Formulas, and My Formulas.
Select the study you wish to add from one of the tabs and click Apply. Multiple studies can be added from this menu.

Click Close once you’re finished adding studies. The selected studies will now appear in your Watch List.

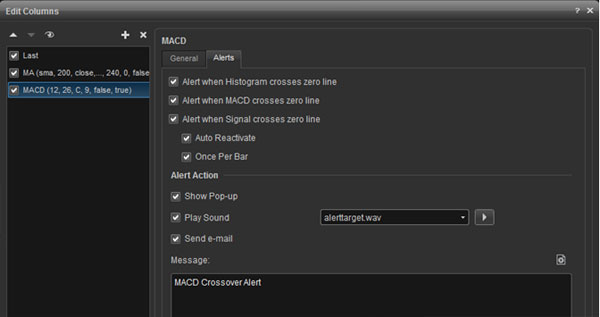
Add an Alert to a Study: To add an alert to a study on the Watchlist, right-click in the Watch List window and selectEdit Columns and select the study you wish to apply an alert to, in this example, the MACD:
Autolist (Regional/Options/Futures): The Autolist feature allows you to easily list all the Regional Quotes and an Option Chain for a specific security in a Watch List. You can also easily list all the monthly contracts for a specific Future. To perform an Autolist for a stock, right click the symbol and choose List regionals or List options. For a list of Regional Exchange Codes click here.
To perform an Autolist for a Future, right click on the symbol and choose List futures. For more information on Inserting a list or creating an Autolist, click here.

Insert List: The right-click menu also provides the option of creating various lists including the Hot List, Sector List, and Index Constituents. To access this feature, right-click the Watch List and select Insert List…

You’ll find 3 tabs including the Hot List, Sector List, and Index Constituents.

Hot List: Hot Lists are powerful pre-built scans that look through the markets to identify the best trading opportunities and update them automatically every 30 seconds. In addition to viewing Hot Lists in the Watch List, they are also available in a separate Hot List window. Click here for more information.
Sector List: The Sector List provides a list of popular symbols within each Industry and Sector.
Index Constituents: Index Constituents allows you to automatically list the symbol components that make up a particular index. Choose from over 1200+ Indices with many more planned in the future.

Click here for more information on the Autolist and Insert List features.
CHART WINDOW
One of the key features in the new Chart window is the way many features are clickable…studies, lines, even the candles and bars are selectable. From there, you can drag and drop studies to overlay or re-order them, or with just a quick double-click, you can edit the selected object. There are also toolbars that slide down into view, and then tuck back up into the title bar when you’re finished with them, to save you even more space.
New Chart : To open a new chart, click the New button from the main menu, then select Chart. A keyboard shortcut (CTRL +1) is also available.

Insert Symbol: To enter a symbol in the Chart Window first ensure that the chart is the active window then type the first letter of the symbol you wish to enter. The symbol will automatically populate the symbol box located in the top left hand corner of the chart window. You can also right-click the chart and select Insert Symbol to bring up the Symbol/Interval prompt.
Insert Interval: There are 2 methods for entering a chart interval. The interval can be changed by typing the interval number (i.e. 5 if it is going to be a five minute chart) or by typing a comma (,) to enter non minute intervals such as D(Daily), W (Weekly), M (Monthly), Q (Quarter), Y (Year), etc.
The second way to enter an interval is by clicking on the interval (clock) icon located next to the interval box. Selecting the interval icon will display a variety of default intervals to choose from. Click here for a description of Tick Based intervals.


The Symbol Link feature allows you to link 2 or more windows together. Once the symbol link has been activated, a symbol change in one window will be automatically reflected in all of windows that have been linked. To link two windows together, just click on the Symbol Linking button and then select a color. Select the same color on the 2nd window and those two windows will be Symbol Linked.

Interval Linking makes it possible to link 2 or more Chart Windows together by Interval. Once the Interval Linking has been activated, interval changes can be easily applied across multiple charts. The Interval Linking works the same way the Symbol Linking button does. Just Click on the Interval Linking button and then select a color. Select the same color on the 2nd Chart Window and those two Charts Windows will be Interval Linked.

Time Templates: Time Templates allow the user to set the start and end times displayed in the Chart Window. They can also be used to specify the number of days or bars that are displayed. Right -click in the Chart Window, go toTime Templates, then you can click on Format to create a Time Template. The window below will appear:

To create a new Time Template, click on the plus sign![]() in the top left hand corner of the Time Template Window.
in the top left hand corner of the Time Template Window.
Name: In the Name Field, provide a name for the new template.
Data Range: Use this feature to request a range of data to be loaded on the chart. Rather than scrolling back to request more data, a set amount of data can be preloaded on the chart using this feature. Dynamic is checked by default. Uncheck this setting if you wish to use the static view (quotes are not updated). You can choose to load a set number of days or bars using the drop down menu.
Sessions: Automatic will set the start and end times based on when the exchanges open and close. You can customize the start and end times by un-checking Automatic and entering the times manually. Click Close once you are finished making changes.
To load your Time Template on the Chart Window, right click in the Chart Window, go to Time Templates and then select your Time Template.
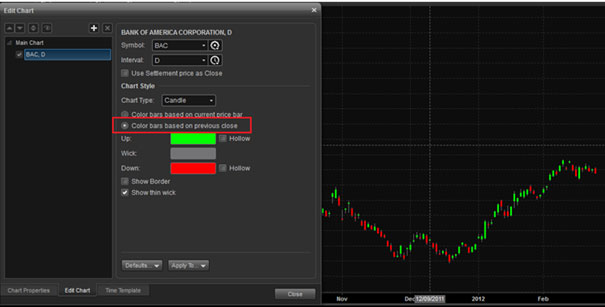
Edit Chart: To access the Edit Chart window, right-click the mouse inside the chart, then select Edit Chart. The Edit Chart window will allow you to edit the symbol and interval as well as the Chart Style and bar color. You can change the symbol and interval in the graph and change the chart style to Candle, Bar, Histogram, Line, or Area chart.

You can choose to display the color of the bars based on current price bar or color bars based on previous close. This last setting will set the bar to display green if the Close for that bar is greater than the Close in the previous bar, or display it red if the Close for a specific bar is lower than the Close in the previous bar.
For daily charts you can choose to use the settlement price as the close instead of the last price. To use the settlement price, check the box for Use Settlement price as Close. Please note that this feature only affects symbols that trade after the settlement price has been released such as the DAX, Gold, and Silver futures.
Chart Type: In the Edit Chart menu, you can choose from a wide array of chart types including Bar, Candle, Histogram, Area and Line charts. Additionally, the following chart types are also available from this menu:

Click here for more information on chart types.
CHART STUDIES
Chart studies are based on the EFS scripting language. Click here for more information on EFS.
Insert Study: To insert a Built-In Study such as Volume or a Moving Average, click the Built-In Studies icon![]() at the top of the Chart. Highlight and left click the study to add it. Alternatively you can right-click the chart and select Insert Study.
at the top of the Chart. Highlight and left click the study to add it. Alternatively you can right-click the chart and select Insert Study.

This will give you access to 3 tabs including Built-In Studies, Formulas, and Add-on Studies. Click here for a list of Add-on Studies which are subscription based.

Edit Study: To edit a study, right-click on the chart, then select Edit Chart. Alternatively, you can access the Edit chart menu by double left-clicking the study on the chart. In the Edit Chart menu, highlight the study in the left panel to make changes.
In the top left corner there are four icons and in the upper right hand corner, there are five icons and two tabs in the section to the right.

The first two icons (up/down arrows) are the Move Item Up and Move Item Down icons can be used to sort the order in which the studies appear. Next is the Unmerge icon, followed by the Toggle Visibility icon. The Toggle Visibility icon toggles the display of the study on the chart on or off. Next is the Insert Study icon (plus sign) will display the Insert Study dialog box so you can select a study in display on the chart. The last icon is the Remove Item icon (X) which will remove the selected study from the chart.
Alerts: You can add an alert to a Built-In study on the chart by right-clicking in the chart window and selecting Edit Chart. Click on the Alerts tab and highlight the study you want to place the alert on. The components of the alerts menu will vary from study to study as it’s based on what’s available from the Properties tab. In this example, the Relative Strength Index is selected:

DRAWING TOOLS
Chart Drawing Tools have been greatly enhanced in eSignal. Tools such as the Ellipse, Rectangle, Triangle, Polyline, Pitchfan, Channel Tools among others have been added. Also added is the ability to have alerts based on drawing tools and a Price Ruler have been added to trendlines to display price distance, percent distance, bar distance and slope.
Click here to see an overview of all drawing tools available in eSignal.
Applying Drawing Tools: Trend lines, text and Fibonacci tools can be accessed via the Drawing Tools Toolbar. Select the Drawing Tools icon![]() to display the Drawing Tools Toolbar. Click the Thumbtack icon
to display the Drawing Tools Toolbar. Click the Thumbtack icon![]() “pin” the toolbar on the chart, so it is always displayed on the chart.
“pin” the toolbar on the chart, so it is always displayed on the chart.

Alternatively you can access the Drawing Tools by right clicking in the Chart window and selecting Insert Drawing Tool. A side menu will appear where you can select the type of line you wish to draw or by using the hot keys that listed by each drawing tool on the menu.

Templates: Allows you create multiple versions of a drawing tool that can be conveniently applied instead of having to edit a tool each time. To create a template, set your new parameters in the Edit Chart dialog box and click theTemplate button at the bottom of the box. Click Save As… and give the template a name.

To apply the template, right-click on the drawing tool icon you want to apply to the chart. In this example, we have created several templates for the Regression Trend drawing tool. By right-clicking the Regression Trend drawing tool, we can select which version we want to apply to the chart.

Line Tool Alerts: You now have the ability to set alerts based on price levels displayed by any line tool on the Drawing Tool Bar. With the Ellipse, Rectangle, and Fibonacci Circle, the alert is generated by the boundary line of the shape. So now you can be notified when the price is near the support or resistance levels by lines or by the boundary of a shape. You can choose to be alerted with an audio alert, pop-up alert, e-mail alert, or by changing the color of the line for few seconds.
To set up an alert on an existing trend line on your chart, right-click the mouse in the chart and click Edit Chart. Select the line tool for which you want to set the alert. In the example below, selecting Trend Line that appears on the left-hand side of the window will display the Properties and Alerts tabs. Click the Alert tab to set the parameters for the alert. (If you have multiple drawing tools on chart, you can set an alert for each one).

To activate the alerts settings, check the box ‘Enable Alert‘, then enter the number of Min Ticks. For example, for stocks the min tick is 0.01, for futures such as the S&P 500 e-mini is 0.25. This means that if you set the min tick as 4, then the alert will trigger when the price falls within the proximity (.04 for stocks and 1.0 for the S&P 500 e-mini) of the alert price.

Automatic Reactivate: Will reactivate the alert every time it triggers.
Once Per Bar: It will trigger the alert once per bar regardless if the price falls within the alert settings in the same bar.
Alert Action: Here you can select the way how you want to display the alert when it triggers and add a message (comment). It could be by highlighting the line with the color of your choice for certain number of seconds, show a pop-up, play a sound, or send an e-mail and a message which will appear in the popup alert and in the Alert Log window.
Trend Lines: The Trend Lines drawing tool has been enhanced in eSignal. Right-clicking on the Trend Line icon ![]() . You can select the type of trend line or select a template (Trend Line 1, in this example) that you have created by right-clicking on the icon, then the following drop down menu will appear:
. You can select the type of trend line or select a template (Trend Line 1, in this example) that you have created by right-clicking on the icon, then the following drop down menu will appear:

Trend Line Properties: If you right-click on a trend line and select Edit, the dialog box for the trend line will appear. Double left-clicking on the trend line will also bring up the Trend Line Properties dialog box:

The first section of the dialog box allows you to edit the formatting parameters of a trend line:

Line Formatting: In this section of dialog box you can edit the Color, Style, Width using the drop down menus to format the line. Unchecking the Extend Left and Extend Right check boxes allows you to have trend line segment. You can then select the End Type from the drop down (highlighted) for one end of the line or both ends.

You can create a default trend line or you can create several versions of lines and save them as a template as described above in the templates section.
Price Ruler: The second section of the dialog box is to set up the trend line as a price ruler. Trend lines have the ability to measure the distance (time and price) and the slope between two anchor points. It can also display a percentage amount to track performance. Check the boxes for Price Distance, Percent Distance, Bar Distance and Slope for the items to be displayed (if any). You can set your selection as the default or as a template, if you wish to use different versions.

Manage Drawing Tools: The Manage Drawing Tools feature allows you to keep track of existing lines and drawing tools. Right-click the chart (excluding a drawing tool or study) and select Manage Drawing Tools:

You’ll find a list of columns that can be sorted by Symbol, Type, Anchor Start/End Time, Start/End Price, and Last Modified. In the top left you can choose to display all symbols, current symbol, or all symbols except current.

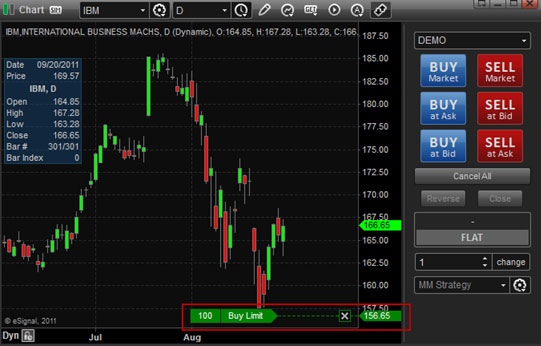
CHART TRADING
eSignal allows you to conveniently place trades directly from the chart window.
Click here for a video demonstratation using the Chart Trading feature.
To get started, visit our Broker Partners page to view a complete list of brokerages and trading service provider partners. Most of our integrated broker plug-ins are automatically included in eSignal. Once you have setup your broker’s plug-in via the Broker Manager, you can begin trading directly from the charts.
There are two components of Chart Trading in eSignal: (1) The Trading Panel and (2) Right-clicking on the chart.
The Trading Panel allows you to open or close a position at the market, at the bid or ask, view a summary of current profit / loss and close or reverse your current positions. Money management strategies can be employed to support partial or fully automated position management.
How to enable the Trading Panel: To enable the Trading Panel, select the Chart Trading icon (up/down arrows)![]() from the title bar at the top of the chart. A keyboard shortcut (Ctrl + T) is also available. It will appear to the right of the chart and become part of the chart window itself.
from the title bar at the top of the chart. A keyboard shortcut (Ctrl + T) is also available. It will appear to the right of the chart and become part of the chart window itself.
Trading by Right-Clicking on the Chart: Right-click on the chart at the price level where you wish to place the order. The following menu will appear:

Display of Position Labels on the Chart: After an order is executed, a position label is placed on the chart. The label in this example is colored green, since it is at a profit. If it was a loss, it would be colored red. The first item on the label is the amount of profit or loss. In this example, the position has $50.00 profit. The number of shares or contracts is the next item. In this case, it is a 1 contract position. The next item is the “R” icon which is the Reverse Position function. Next on the position label is the “X” icon which closes the position. Finally, on the price axis, the entry price of the position is highlighted with a colored arrow. The color of the arrow will be green if the position is profitable and red if it is a loss.
Click here for more information on Chart Trading.
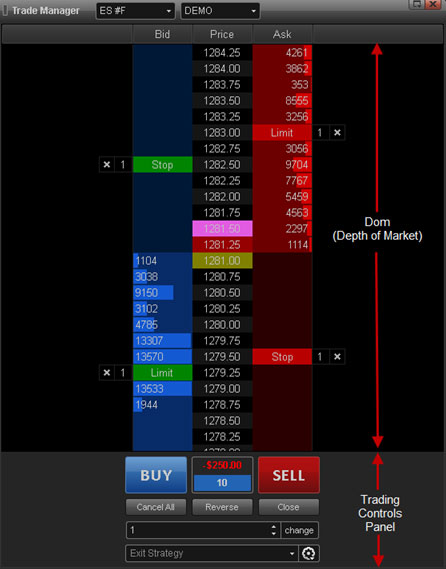
TRADE MANAGER / MONEY MANAGEMENT PLANNER
Trade Manager
Overview: eSignal’s Trade Manager has been dramatically improved to give you even more power and flexibility to respond to rapid changes in the markets. It enables you to quickly place or modify orders with a single mouse click while viewing real-time market depth on a DOM (Depth of Market) display. DOM is also referred to as a Price Ladder. We have also added a Trade Controls Panel and with the new Money Management Planner window, it is now possible to create and implement sophisticated trade management strategies, such as scaling out of positions, trailing stops, multi-level trailing stops, etc.
Open a Trade Manager Window: To open a Trade Manager window, click New / Trade Manager from the main menu. A keyboard shortcut (Ctrl+Alt+T) is also available.
Money Management Planner
The Money Manager in combination with the Trade Manager and Chart Trading, allows traders to use predefined, sophisticated and intelligent order management for profit taking and loss mitigation after an entry has been established. The Money Manager is used to set up various stop and profit orders to automatically come into play once the entry order is filled. These stop and profit strategies can be setup to change from fixed stops to trailing stops multiple times and on multiple levels as long as the position is still active.
Note: Money Management Strategies are not supported for TD Ameritrade, FXCM, MB Trading, Oanda, and TransAct due to API limitations. Broker APIs must provide average price calculations in order for MM Strategies to perform correctly. This calculation is not provided by the eSignal application at this time (as of the eSignal.2 release).
Opening the Money Management Planner: Click Trade, on the main menu bar, then select Money Management Planner.

Money Management Icons:
![]()
In the New Strategy box enter a name for the Strategy and click OK.

Set the parameters for each of the fields and click Close.

Click here for more information on using the Money Management Planner.
HOT LIST WINDOW
Hot Lists are pre-built scans that look through the markets to identify the best trading opportunities and update them automatically every 30 seconds. There are the traditional gainers, losers and volume lists here, but also unique scans, such as Unusual Volume, Most Volatile and Trade Rate Hot Lists.
To open a Hot List, select New from the main menu then click Hot List.

The Hot List appears in a spreadsheet format with the symbols listed by Value. The Value is dependent on the Hot List.
To avoid the inclusion of thinly traded equities, only equities that trade at least 100,000 shares with at least 50 transactions will be included in the results, although some exceptions may apply. Hot Lists begin to calculate at market open (9:30 am ET) with some lists continuing to update with post market activity (NASD Trade Rate, for example). Pre-market activity is not included.
Click here for more information on Hot List Window.
MARKET DEPTH
The Market Depth window displays the best bid and ask prices by Market Maker in descending order. It’s used to help gauge supply and demand to potentially identify buying and selling opportunities. This window is commonly used to view NASDAQ Level 2 although other views such as TotalView, CME Depth, and NYSE Openbook are gaining in popularity.
To Open a Market Depth Window select New from the Main Menu, followed by Market Depth. A keyboard shortcut (Control +4) is also available.

Symbol: On the title bar, enter the symbol and press enter:
![]()
Depending on the symbol you select, the next field will display the views available for that symbol. For NASDAQ symbols Level 2, TotalView, ARCA and Singlebook may be available. If you’re viewing a CME Globex symbol such as the E-minis (ES #F), CME Depth will appear in this field.
DOM Mode, Depth, and Ticker: To access the DOM Mode or to display the Depth Meter, Ticker, or Net Order Imbalance.

DOM Mode (Depth of Market): This function will split the Bid/Ask data field vertically, displaying the Ask data on top and Bid data at the bottom of the split:

ADDITIONAL WINDOWS
For information on other windows types that are available. Please see the following:
SYMBOL SEARCH
The symbol search window allows you to search for issues by symbol, description or cusip (requires cusip subscription). To access the symbol search window, left-click on the tools icon on the menu bar. A keyboard shortcut (control +f) is also available.

When finished with selecting the search criteria, click the Go icon on the title bar to begin the search:
![]()
Click here for more information on the Symbol Search tool.
Wherever possible, eSignal uses standard exchange symbology. We have separated the formats into their respective categories, so they’re easier to follow.
See our Symbol Directory for a list of all A – Z listings and Symbol Formats for specific exchange codes.
Indices: Index symbols begin with a $ sign (example: $INDU is the Dow Jones Industrial Average). Delayed Indices are available at no cost. For Real-time Index data you must subscribe to the appropriate service.
For a list of Popular symbols including info on our Global Indices please see our Symbols Guide – eSignal Indicesand Index FAQ’s for more information.
COMPOSITE SYMBOL MANAGER
The Composite Symbol Manager is used to create continuous contracts for futures and to create spreads. It combines the Continuous Contracts Settings and Spread Symbol Settings tools in the previous versions of eSignal.
To launch the Composite Symbol Manager, on the main menu bar click Tools, then Composite Symbol Manager:

You can also access the Spread Builder and Continuous Contract Builder directly from the Watch List by double left-clicking on a symbol:

To create a new spread or to configure a continuous contract, click the Add icon in the dialog box:

Continuous Contracts: The Composite Symbol Manager allows you to configure continuous contracts for futures. eSignal provides default rollover and included months for #F and 1! symbols, but the Composite Symbol Manager allows to create your own customized continuous contract based on contract forward month, rollover date, included months and whether it is back adjusted or not. To access the Continuous Contract Builder, click the Option Icon ![]() and select Insert Continuous Contract:
and select Insert Continuous Contract:

Click here for more information on continuous contracts.
Spreads: To create a spread, click the Option Icon ![]() and select Insert Spread:
and select Insert Spread:
Click here for information on how to create spreads.
BAR REPLAY
The Bar Replay tool allows you to move to a previous point in time to simulate Real-time trading. It lets you test your formulas and strategies using historical data played back in Real-time. You can make adjustments to a custom formula or change the set of indicators you’re using and then just go back and replay the data again. You can then watch how the indicators react and see if expected trends play out as the chart steps forward. This helps you fine tune everything to be ready for the next day of trading.
To access the Bar Replay, select the Bar Replay icon (highlighted in red below) located towards the top of the chart.
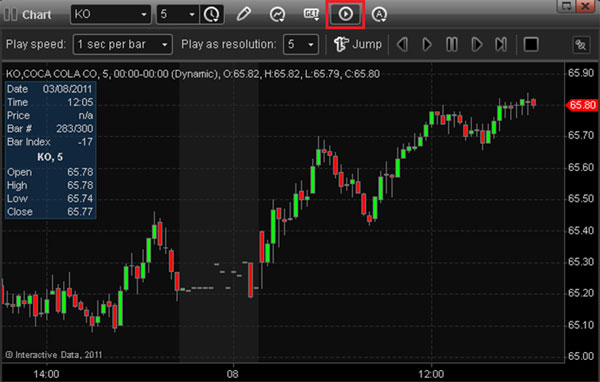
Once the Bar Replay menu is visible, click Jump. Your cursor will change to a smaller crosshair with a small vertical line. Left-click towards the left side of the chart to determine your starting point. Continue left-clicking until you reach your desired starting point. An alternate method for determining your start point would be to scroll back on the chart by pressing Control + Left arrow on your keyboard.
Click here for more information on using Bar Replay.
![]()
DATA SIMULATOR
The Data Simulator allows you to create trading scenarios using simulated data to create five different market environments: strong down, down, flat, up, and strong up.
Insert Simulated Symbol: To use the Data Simulator tool, you’ll first need to Insert a Simulated Symbol. Left click the Gear Icon next to the symbol field on the title bar of the chart and select Insert Simulated Symbol. Please note you can insert and use the Insert Simulated Symbol in several window types such as the Time & Sales, Market Depth, etc.

Click here for more information to configure and apply the Data Simulator.
UNDO / REDO
The Undo / Redo feature is organized by window. If you currently have a Watch List selected, this feature will appear under the Watch List menu. Since this feature is tied to the window, you can conveniently undo errors from one window from earlier in the day without losing the changes you made to other windows during the same period.
For example, if you’ve entered symbols in the Watch List followed by many changes throughout the day to your charts, you can easily undo the changes to your Watch List without impacting the work you’ve done on the charts. Select the Watch List menu followed by Undo or use the keyboard shortcuts (Control+Z to Undo and Control +Y to Redo).

BACKUP/RESTORE
With the Backup/Restore feature, you can now easily back up and restore your eSignal files and settings. Creating a backup file is recommended to preserve all your work in the event of a system failure or other unforeseen event. Once you have created a backup file, it can be easily transferred to another PC by saving the file on a USB drive or CD. You can copy the backup file to a cloud-based solution such as eSignal File Share or Dropbox, and access your eSignal files from anywhere!
Once you have installed and launched eSignal version 11.2 or newer, click on the eSignal button ![]() on the menu bar and select Backup:
on the menu bar and select Backup:

Restoring the Backup: To restore the backup file, click the eSignal button ![]() and select Restore:
and select Restore:

PRINTING
To Print, click the eSignal button ![]() on the main menu followed by Print or Print Preview:
on the main menu followed by Print or Print Preview:

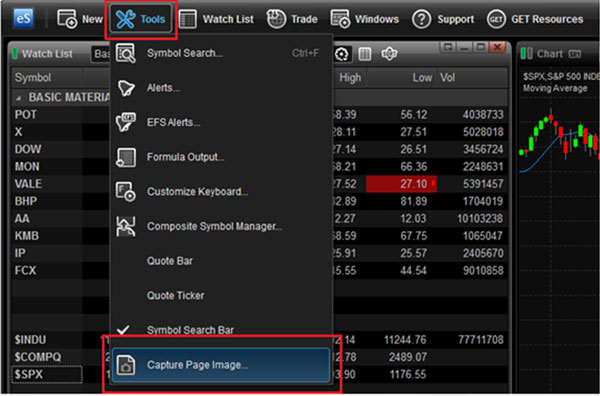
SCREENSHOT TOOL
The Screenshot tool allows you to capture an image of a complete page or any individual window.
Screenshot of a Page: To take a screenshot of a page, go to Tools in the top bar of the program and click Capture Page Image…
Click here for more information on using the screenshot tool.
eSIGNAL FORMULA SCRIPT (EFS)
eSignal uses the JavaScript language as a foundation for eSignal Formula Script, or “EFS” for short. This allows you to develop your own custom studies, as well as a series of customizable sample formulas, so you’ll be able to test your trading strategies on days, weeks and years of historical data.
EFS Help Center and Library: Here, you will find a complete collection of EFS reference materials, how-to guides and an extensive library of EFS formulas developed for eSignal users.
To suggest an EFS study to be developed by eSignal, please post the details of the study to our New Study Suggestions forum. (You must be a registered member of the eSignal Forums in order to use this service; registration is free.) Register now to join the eSignal Forums.
The “JavaScript for EFS Video Series” educates the viewer on programming concepts, using JavaScript, the foundation language for eSignal Formula Script (EFS). This series also leads the viewer through many examples using the EFS Editor and the EFS Output Window. It is the perfect place to start for someone who is new to programming and wanting to learn more about it.